SGS Market Timer Status: SHORT
LONG as of the close of Friday, February 9, 2018
SGS is a Long-Term (weeks to months) Timer
Why Market Timing Is A Must
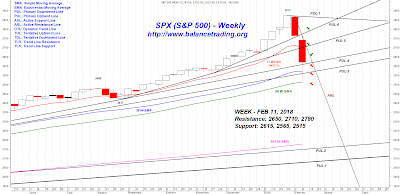
SPX broke through one support after another last week and finally bounced off of its 200 D-SMA on Friday. Breadth and Internal data deteriorated, significantly signaling more selling ahead.
SGS declined last week and by Friday it closed significantly below -50. SGS status as of the close of last Friday is SHORT.
SPX found support at its 200 D-SMA and PUL-3 on Friday. There is a good chance that the rally that started on Friday continues next week and SPX retraces back between 40% to 60% of its decline from all-time of 2872.
SPX: S&P 500 Index SMA: Simple Moving Average
DJI: Dow Jones Industrial Index EMA: Exponential Moving Average
DJT: Dow Jones Transportation Index PDL: Primary Downtrend Line
NAZ: NASDAQ Composite Index PUL: Primary Uptrend Line
RUT: Russell 2000 Index ASL: Active Support Line
OEX: S&P 100 Index ARL: Active Resistance Line
NDX: NASDAQ 100 Index DTL: Dynamic Trend Line
TUL: Tentative Uptrend Line TDL: Tentative Downtrend Line
LONG as of the close of Friday, February 9, 2018
SGS is a Long-Term (weeks to months) Timer
Why Market Timing Is A Must
SPX broke through one support after another last week and finally bounced off of its 200 D-SMA on Friday. Breadth and Internal data deteriorated, significantly signaling more selling ahead.
My Plan
My plan is to close my long positions this coming week as SPX retraces back its decline. Closing an open position with a loss is the most difficult skill to master in trading. A trader without that skill will never be a successful trader.
I will tweet next week as I close long positions.
Current Long-Term Portfolio (2018)
Past Long-Term Portfolios (2008-2017)
I will tweet next week as I close long positions.
Current Long-Term Portfolio (2018)
Past Long-Term Portfolios (2008-2017)
SPX: S&P 500 Index SMA: Simple Moving Average
DJI: Dow Jones Industrial Index EMA: Exponential Moving Average
DJT: Dow Jones Transportation Index PDL: Primary Downtrend Line
NAZ: NASDAQ Composite Index PUL: Primary Uptrend Line
RUT: Russell 2000 Index ASL: Active Support Line
OEX: S&P 100 Index ARL: Active Resistance Line
NDX: NASDAQ 100 Index DTL: Dynamic Trend Line
TUL: Tentative Uptrend Line TDL: Tentative Downtrend Line
TLR: Trend Line Resistance TLS: Trend Line Support
Disclaimer: The views expressed are provided for informational purposes only and should not be construed in any way as investment advice or recommendation. Furthermore, the opinions expressed may change without notice.
Disclaimer: The views expressed are provided for informational purposes only and should not be construed in any way as investment advice or recommendation. Furthermore, the opinions expressed may change without notice.


